

Read your Analytics
What the five figures, the Pipeline chart and the Lead sources table on Analytics show.
Analytics in the sidebar shows how your deals and lead sources are doing, from everything in your account.
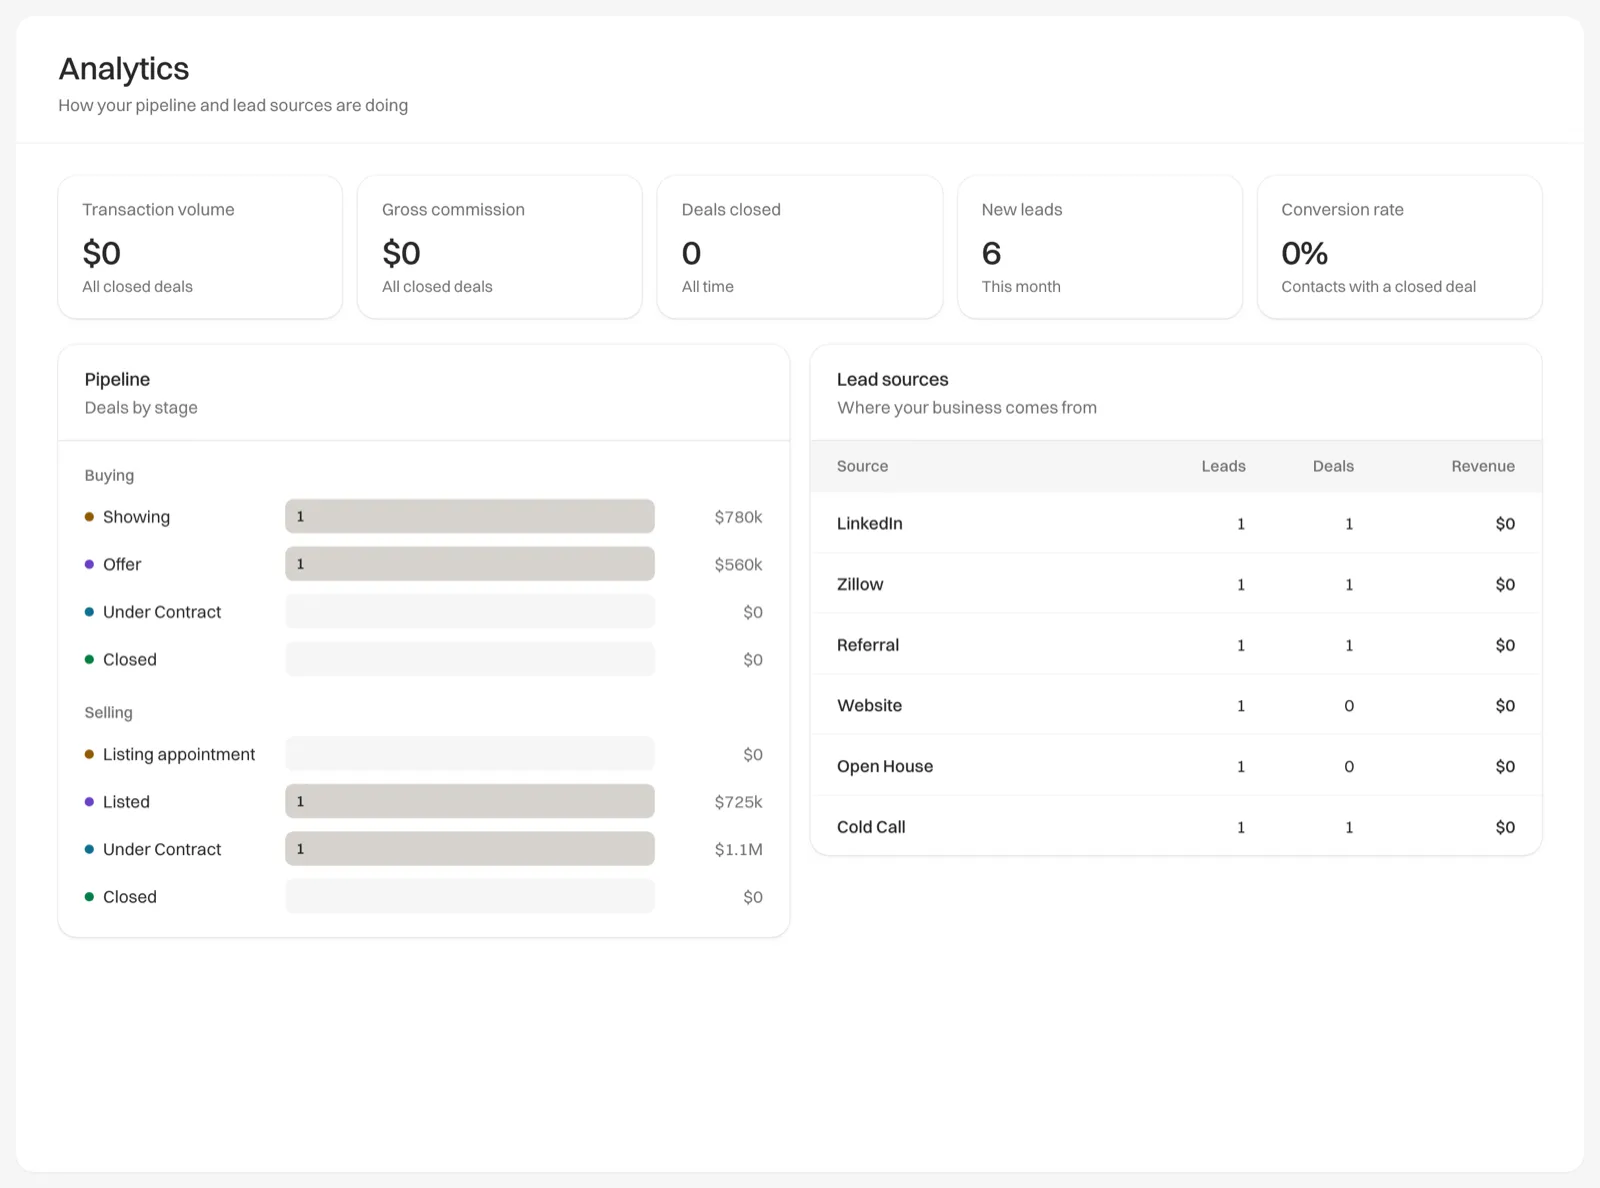
The five figures
| Figure | What it shows |
|---|---|
| Transaction volume | The sale prices of your closed deals, plus Sold listings without a deal |
| Gross commission | The commission from your closed deals, plus Sold listings without a deal |
| Deals closed | How many deals have reached Closed, on both sides |
| New leads | How many contacts you have added since the 1st of this month |
| Conversion rate | The share of your contacts who have at least one closed deal |
Each one is explained in detail in How Analytics counts your numbers.
Pipeline: Deals by stage
Pipeline lists every stage, grouped under Buying and Selling. For each stage:
- The bar shows how many deals are at that stage.
- The figure on the right is their total value. For Closed, it is their sale prices, and Selling’s Closed row adds your Sold listings without a deal, so the two Closed rows add up to Transaction volume.
Lead sources
Lead sources shows your ten biggest sources, with the Leads, Deals and Revenue each one brought in. See Lead sources and how to set them.
Good to know
- There is no date range to pick. Every figure is all time, except New leads, which is this calendar month.
- The figures are worked out when you open the page. Reload it to see a change you just made.
- If the page can’t load, it says “Could not load your analytics” rather than showing zeros. Click Try again.